Part 3 - How to Use the SAIS Website
In part 3 of our series on winter weather and avalanche forecasts, Will guides us through the many useful features of the SAIS website...
The Scottish Avalanche Information Service (SAIS) website is a fantastic resource for walkers, climbers and skiers; here you'll find daily forecasts, a conditions blog, avalanche education resources and links to other useful sites, such as the Met Office. There's a lot of information to digest on this site, and it can seem a little overwhelming on first acquaintance. Hopefully this article will help with navigating it.
Key things to note:
- There are six forecast regions
- They're updated daily and are valid from 18.00 for a 24 hour period
- They're forecasts – mountains vary a lot, as does the weather, so it's best not to take them verbatim
- England and Wales do not have an avalanche service
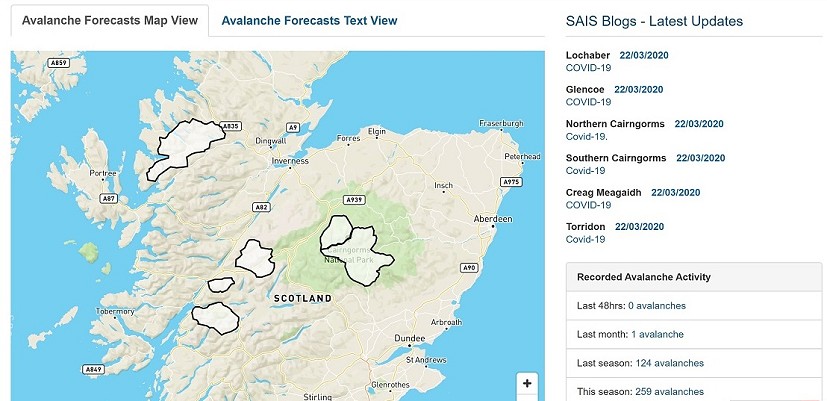
The map below shows the six forecast areas: Torridon; Northern Cairngorms; Southern Cairngorms; Creag Meagaidh; Lochaber and Glen Coe.
Clearly there are lots of Scottish mountains which aren't covered by the forecasts, as they're less frequented and the SAIS can only do so much. The lack of a forecast isn't to be underestimated – venturing into such areas will feel quite daunting to most people and is probably best left until you feel you have an appropriate level of understanding and confidence in avalanche terrain.
During the season each forecast area will have its own colour for each day, relating to the avalanche hazard. The areas in the diagram above are colourless, as this was made after the season had finished, but you can see the forecast areas. To obtain a forecast, simply click on the appropriate area.
I'd like to draw your attention to the right-hand side of the picture above, you'll see two separate boxes: SAIS Blogs and Recorded Avalanche Activity. It's good to get into the habit of checking these each day, as they'll help to build an overall picture of what's going on in the snowpack and of mountain conditions generally.
SAIS Blogs
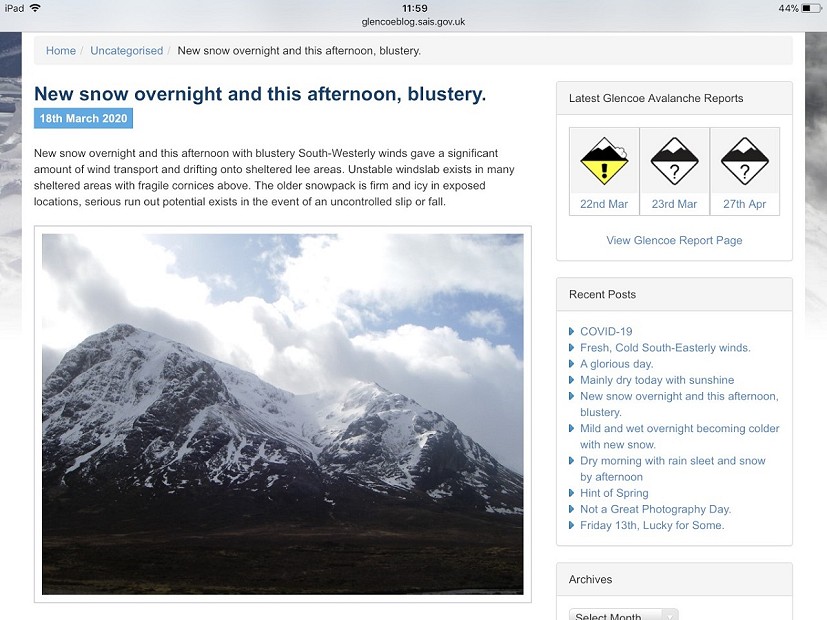
The forecasters generally update a blog for their specific area each day. They'll often have pictures and a few lines describing the conditions. This information is invaluable. With a keen eye you'll be able to see where the snow has accumulated, how the crags look if you're aiming to go climbing, and soak up any gems they share about the snow's behaviour. As with the avalanche forecasts, you can access earlier blogs to get a feel for what's been happening.
Recorded Avalanche Activity
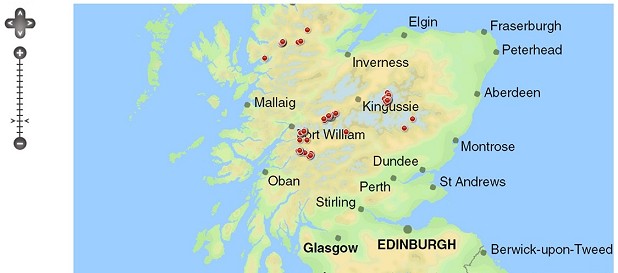
You'll see the Recorded Avalanche Activity box on the right of the main page. This is very useful, it gives the statistics for the number of reported / observed avalanches in a given time frame. Each red dot on the map below is a recorded avalanche.
Aside from giving a general impression of where they happen, the time frame is really handy. As an example, if you were travelling up on a Friday night and saw that 12 avalanches had been recorded in the last 48 hours, I imagine it'd get you thinking! This isn't to say that if none have been recorded you can relax, it could be a result of nobody going out because it's too dangerous...
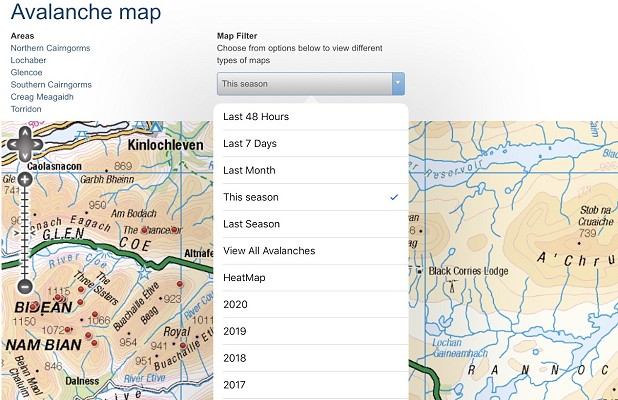
You can then choose a certain area and filter the results into a relevant timeframe, as shown below:
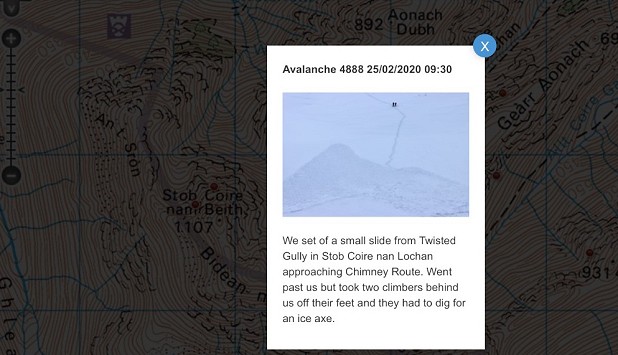
I chose to look into Glen Coe and a number of results came up on Stob Coire nan Lochan, a very popular peak and climbing area. You can then click on the dot for further information. There's always text and sometimes a photo, as shown in the example below. The text is written by the person who reported the avalanche, who will often be a member of the public rather than an avalanche forecaster, so don't read too heavily into the detail.
Despite coming from random self-selecting sources, these comments can be interesting, and I think there's great learning to be had by reading the comments; you can try to put yourself in their shoes and think about why it may have happened to them. It's even better if you find the relevant avalanche forecast and blog for that day to piece it all together.
The avalanche forecasts
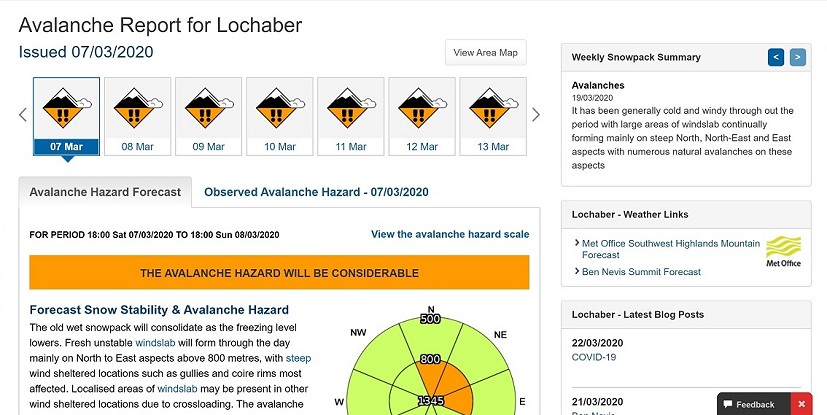
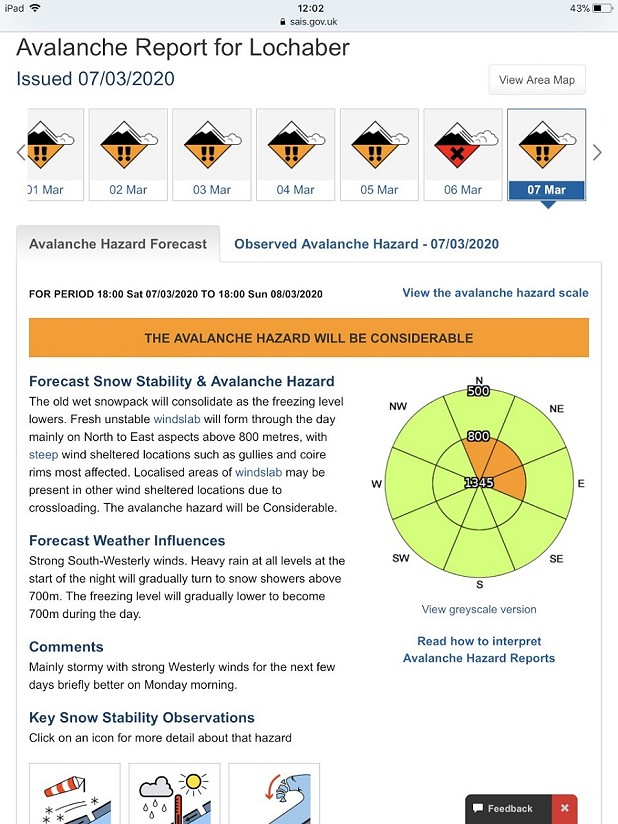
So, to the forecasts themselves. Let's say you're thinking about visiting the Ben Nevis area, you'll need the Lochaber avalanche forecast, as shown here:
I'd like to draw your attention to some important features relating to the weather. On the right, you'll see Lochaber - Weather Links. These click through to the regional mountain forecast and the hourly summit forecast for the highest mountain in the Lochaber area, Ben Nevis. The blog is just below as well.
Avalanche hazard forecast
The forecast below was issued on Saturday 7th March 2020 for Sunday 8th March. It was issued at 18.00 on the Saturday evening, and will be valid till 18.00 on the Sunday.
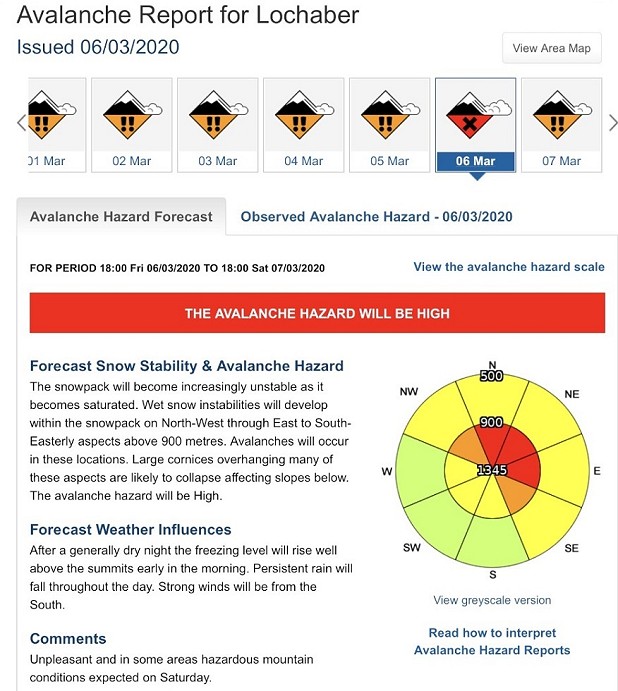
Just below the rose, that coloured wheel, you'll see the link: Read how to interpret Avalanche Hazard Reports. Just above you'll find: View the avalanche hazard scale. This is absolutely essential information to understand – it's well worth grabbing a brew, sitting down and slowly working through it.
The diagram, or avalanche rose as it's also known, is intended to be used in combination with the text to its left. The rose is a fantastic visual tool but doesn't inform the user about what the hazards are, or where they're likely to be found. For this, you'll need to read the text to the left.
Reading the Forecast Snow Stability & Avalanche Hazard section
This section is gold, every sentence is a nugget! This is where you'll find the detailed information about how the snow will change and behave according to the weather, the types of avalanche hazard you're likely to encounter and where you'll find them. The information in this section should play a big part in planning a day out in the hills.
Why the Forecast Weather Influences section matters
The SAIS team use weather forecasts to help them generate the avalanche forecasts. The more accurate the weather forecast, the more accurate the avalanche forecast. They describe what they've based their predictions on under Forecast Weather Influences.
As a mountain-goer, the best thing to do is to note the Forecast Weather Influences and compare them to the weather conditions you witness once you're on the hill.
As an example, the Forecast Weather Influences section of the report above details:
- Strong south westerly winds
- Heavy rain at all levels during the night
- Rain turning to snow showers above 700 metres
- The freezing level lowering to 700 metres through the day
If you set off from the road and observed all the influences above then you'd expect the avalanche forecast to be accurate.
If however, you noticed something different, let's say a strong easterly wind, then the forecast would no longer be accurate. If something is different, stop. Highlight it and discuss it amongst yourselves. Change what you're doing accordingly, and if you're not sure, then I'd suggest reigning things in and choosing more conservative options.
The Comments section often has practical advice that's well worth paying heed to. Below this section you'll find the avalanche icons, they're the main types of avalanche hazard that the forecasters think we'll be coming up against on any given day. They vary according to the snowpack and weather. You can click on them for more information, and during the season a small arrow will appear, suggesting whether that particular hazard is reducing, staying the same, or increasing.
Top tip – annotate your map
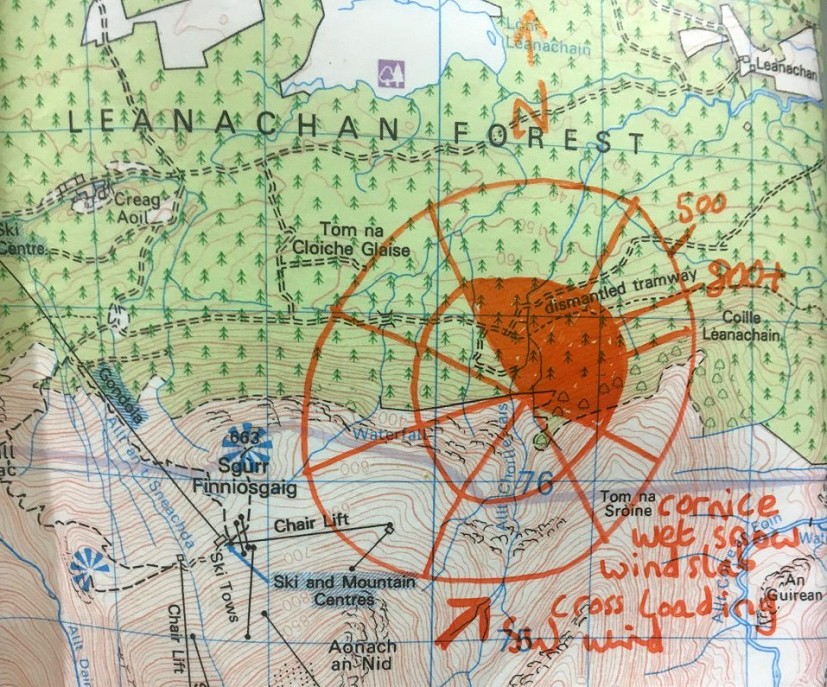
Once I'm out for the day, I often struggle to remember all the information in the forecast. If you have a mobile phone you could use the Be Avalanche Aware app. This shows the avalanche rose and text. That said,out in the weather I struggle to use my phone with gloves on. On the other hand, I always have a map to hand. I use a laminated map and annotate it with a permanent marker each day. This can be rubbed off each evening with an alcohol-based solution, or even a cheeky spray of deodorant (the right kind though!).
In this example you'll see I've added the essential bits of information:
- the avalanche rose with altitude changes
- arrows to show the direction the wind is coming from
- the freezing level
- the main hazards of the day (windslab / wet snow instabilities / cornice collapse)
- where I'm most likely to find the instabilities (coire rims / gullies)
Reading the Observed Avalanche Hazard section
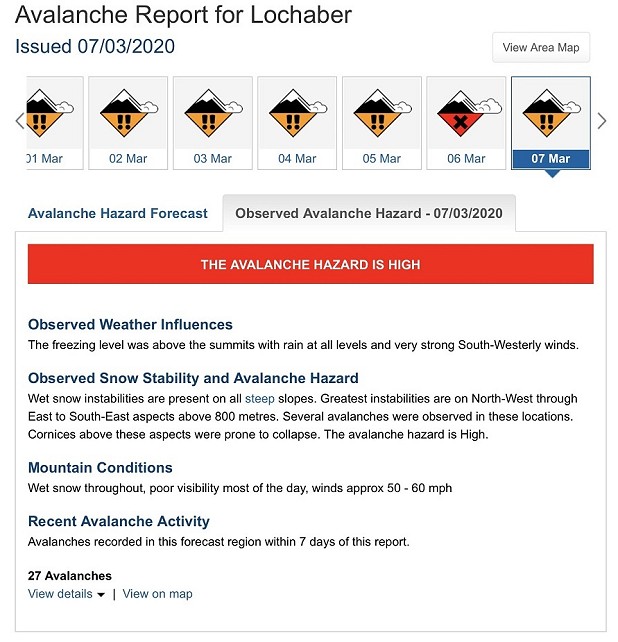
You'll find this tab at the top of the avalanche forecast. It's really handy.
Let's say you'd driven to the hills on Saturday 7th March. We'll imagine you're on the west coast (because west is best after all), and are now sat in the pub.
It's Saturday night. The forecast has been updated: As shown above, the forecast is Considerable for tomorrow, Sunday 8th. You drove all day, so haven't yet set foot on the hill: but you can still find out what the avalanche hazard actually was today by reading the Observed Avalanche Hazard section.
By reading this you can gain useful insight into what's been going on and why the snow has behaved in a certain way.
I would then look back at the forecast issued on Friday 6th and read why the forecasters thought it would be High, given the Forecast Snow Stability and Forecast Weather Influences.
Checking the forecast and observed avalanche hazards together is a brilliant way to improve your understanding of avalanches and how weather affects the snow. The great thing is, you don't even need to be in situ at the bottom of the hill, you can keep your eye in even if you live miles away. Sometimes the observed avalanche hazard differs from the forecast, it can be safer or more dangerous – the key is to read why it was different. This will be explained in the observed section. There's lots to be gleaned when this happens.
Top tips:
- Keep an eye on the avalanche forecasts and blogs before you go to the hills to get an idea of what's happening
- Carefully read the forecasts for at least a week before you go. You can read the entire winter's forecast history if you'd like
- Sit down with a brew, somewhere quiet, and take time to read and understand the forecast
- Explore the SAIS website
- Download and look around the Be Avalanche Aware app
- If you don't understand certain parts of the avalanche forecast then find out more – it's your neck on the line at the end of the day!
Further reading - brilliant books include:
Staying Alive in Avalanche Terrain and Avalanche Essentials by Bruce Tremper
Chance in a Million by Bob Barton and Blyth Wright
All Plas y Brenin winter courses cover in detail the topics described in this series. Attending a course is probably the best way to develop the skills and understanding you'd want to head out in winter independently.
If you'd like to learn more about getting out in winter, Plas y Brenin are running a series of webinar sessions designed to give you the skills you need, and the majority of them are free to attend. Head over to www.pyb.co.uk/events to see what's on and register now.
